Plot camera trap activity over time
Source:R/ct_plot_camtrap_activity.R
ct_plot_camtrap_activity.RdVisualizes the activity history of camera trap deployments to show periods of data capture. It also optionally highlights periods of inactivity (break/gap).
Usage
ct_plot_camtrap_activity(
  data,
  deployment_column,
  datetime_column,
  threshold = 5,
  time_unit = "days",
  format = NULL,
  activity_style = list(linewidth = 0.8, color = "steelblue", alpha = 0.7, linetype = 1,
    label = "Active period"),
  break_style = list(linewidth = 0.8, color = "#c90026", alpha = 0.9, linetype = 1, label
    = "Break period"),
  show_gaps = TRUE,
  ylabel_format = "%Y-%m-%d",
  ybreak = paste(nrow(data)%/%10, time_unit),
  legend_title = "Activity"
)
Arguments
- data
A data frame containing the datetime column.
- deployment_column
Column name (unquoted) that identifies the deployment or camera ID.
- datetime_column
The datetime column.
- threshold
A numeric value indicating the minimum gap to be considered a break (default is 10).
- time_unit
The unit for the threshold. Supported values include "secs", "mins", "hours", "days", and "weeks".
- format
Optional. A character string specifying the datetime format, passed to
as.POSIXlt.- activity_style
A list controlling the appearance of active periods. Can include:
linewidth: Line width (default 0.8)color: Color of activity bars (default"steelblue")alpha: Transparency (default 0.7)linetype: Line type (default 1)label: Legend label for active periods (default"Active period")
- break_style
A list controlling the appearance of gaps/inactive periods. Can include:
linewidth: Line width (default 0.8)color: Color of gap bars (default"#c90026")alpha: Transparency (default 0.9)linetype: Line type (default 1)label: Legend label for break periods (default"Break period")
- show_gaps
Logical. If
TRUE(default), shows vertical bars for detected gaps in deployment activity.- ylabel_format
Character. Format for y-axis date-time labels. Default is
"%Y-%m-%d".- ybreak
Character. Spacing for y-axis breaks, e.g.,
"1 days"or"12 hours". Default is based ontime_unit.- legend_title
Character. Title of the colour legend that distinguishes active periods from breaks (default
"Activity").
Value
A ggplot2 object showing periods of activity (and optionally gaps)
for each deployment. Active periods and breaks are mapped to colour, so a
legend is drawn (blue for active periods, red for breaks by default). Because
the return value is a standard ggplot object, it can be customised further
with the usual + syntax (for example + ggplot2::labs() or
+ ggplot2::theme()).
Examples
# Load example data and filter for one project phase
data(penessoulou)
camtrap_data <- penessoulou %>%
dplyr::filter(project == "Last")
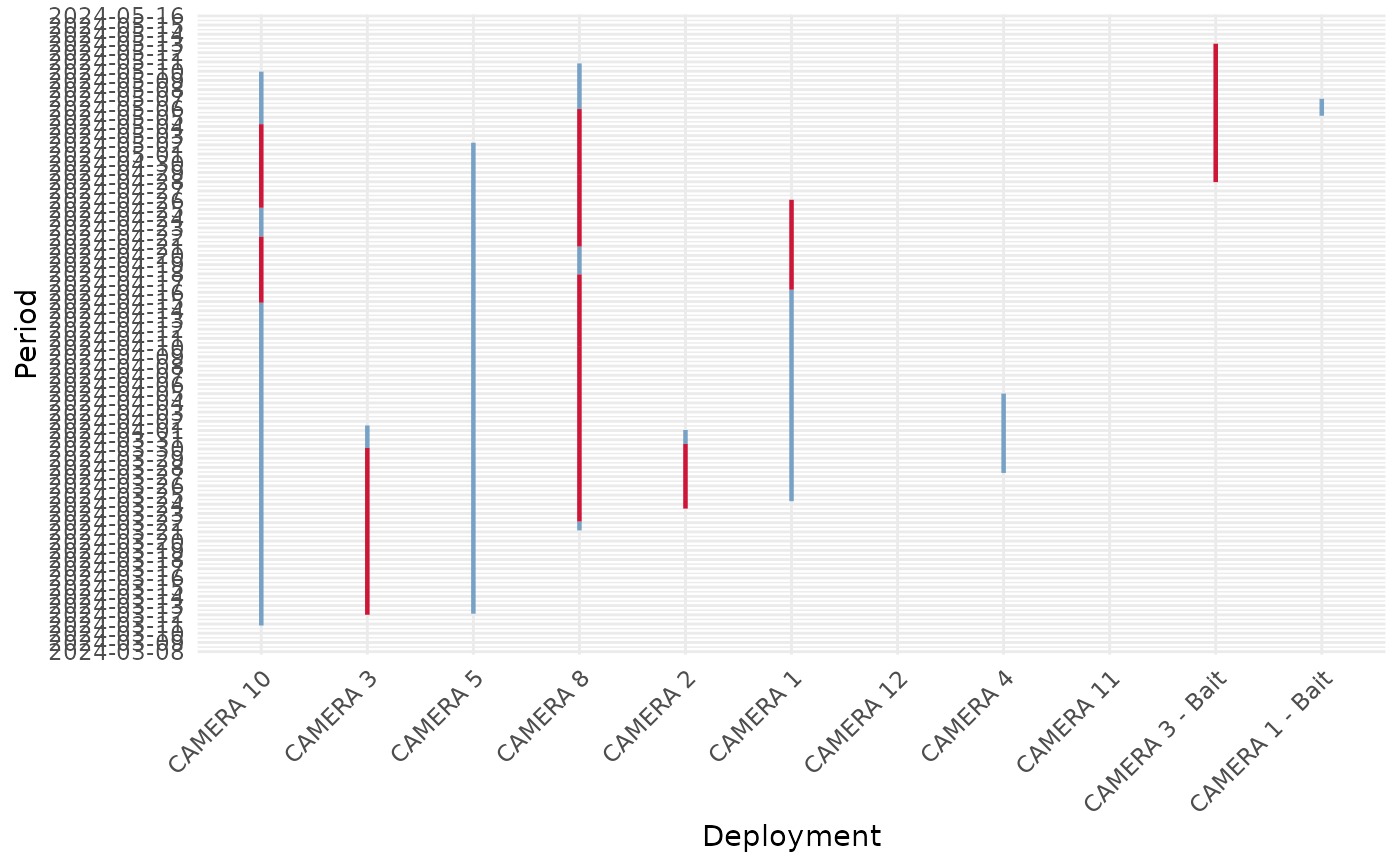
# Plot with default styles (a legend distinguishes active periods from breaks)
ct_plot_camtrap_activity(
data = camtrap_data,
deployment_column = camera,
datetime_column = datetimes,
threshold = 7,
time_unit = "days"
)
#> Warning: No deployment has a gap exceeding 7 days.
#> Warning: No deployment has a gap exceeding 7 days.
#> Warning: No deployment has a gap exceeding 7 days.
#> Warning: No deployment has a gap exceeding 7 days.
#> Warning: No deployment has a gap exceeding 7 days.
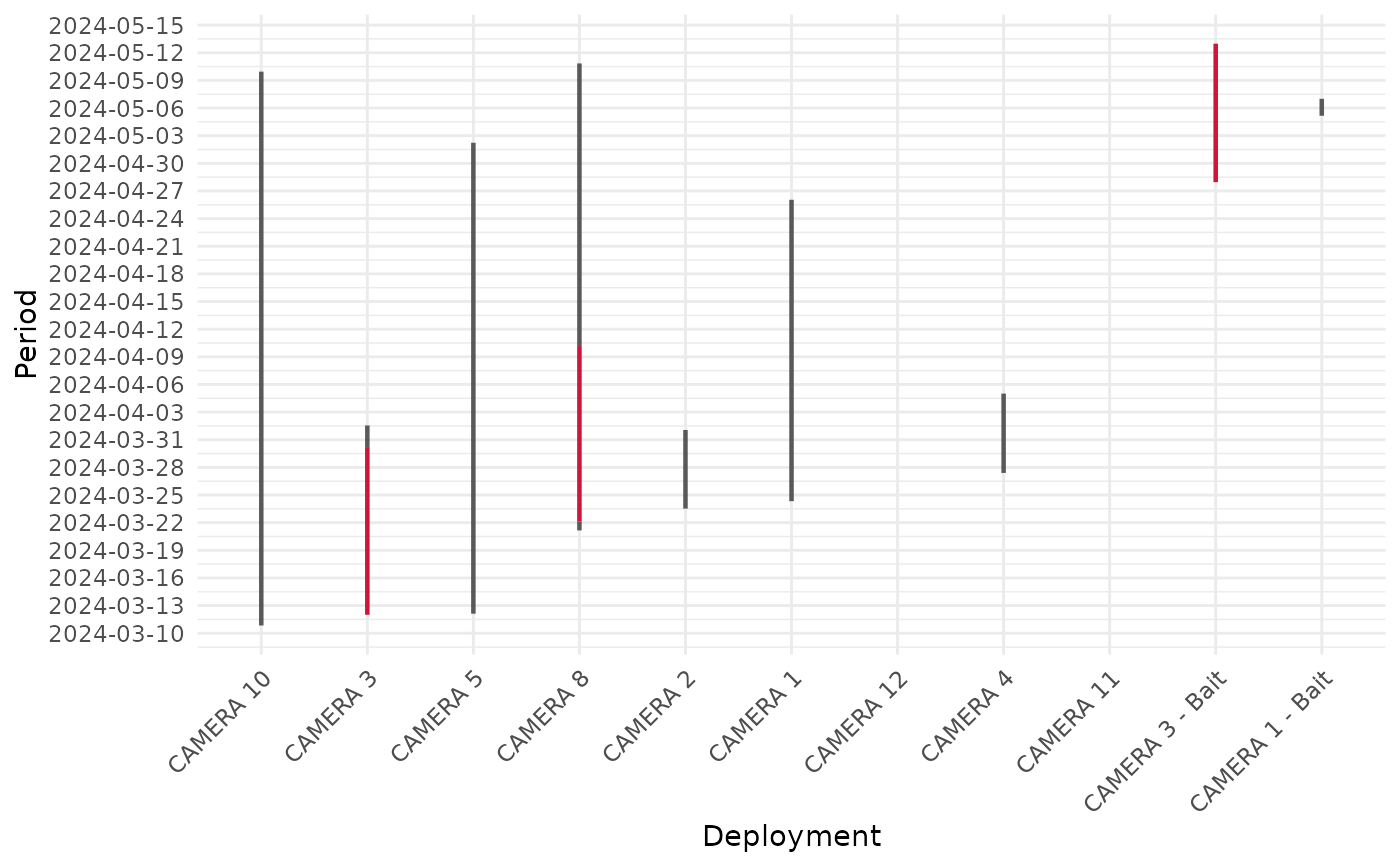
 # Customise the colours, the legend labels and the legend title
ct_plot_camtrap_activity(
data = camtrap_data,
deployment_column = camera,
datetime_column = "datetimes",
threshold = 15,
time_unit = "days",
ybreak = "3 days",
activity_style = list(linewidth = 1.1, color = "gray10", label = "Recording"),
break_style = list(color = "orange", label = "Gap"),
legend_title = "Camera status"
)
#> Warning: No deployment has a gap exceeding 15 days.
#> Warning: No deployment has a gap exceeding 15 days.
#> Warning: No deployment has a gap exceeding 15 days.
#> Warning: No deployment has a gap exceeding 15 days.
#> Warning: No deployment has a gap exceeding 15 days.
#> Warning: No deployment has a gap exceeding 15 days.
#> Warning: No deployment has a gap exceeding 15 days.
#> Warning: No deployment has a gap exceeding 15 days.
# Customise the colours, the legend labels and the legend title
ct_plot_camtrap_activity(
data = camtrap_data,
deployment_column = camera,
datetime_column = "datetimes",
threshold = 15,
time_unit = "days",
ybreak = "3 days",
activity_style = list(linewidth = 1.1, color = "gray10", label = "Recording"),
break_style = list(color = "orange", label = "Gap"),
legend_title = "Camera status"
)
#> Warning: No deployment has a gap exceeding 15 days.
#> Warning: No deployment has a gap exceeding 15 days.
#> Warning: No deployment has a gap exceeding 15 days.
#> Warning: No deployment has a gap exceeding 15 days.
#> Warning: No deployment has a gap exceeding 15 days.
#> Warning: No deployment has a gap exceeding 15 days.
#> Warning: No deployment has a gap exceeding 15 days.
#> Warning: No deployment has a gap exceeding 15 days.
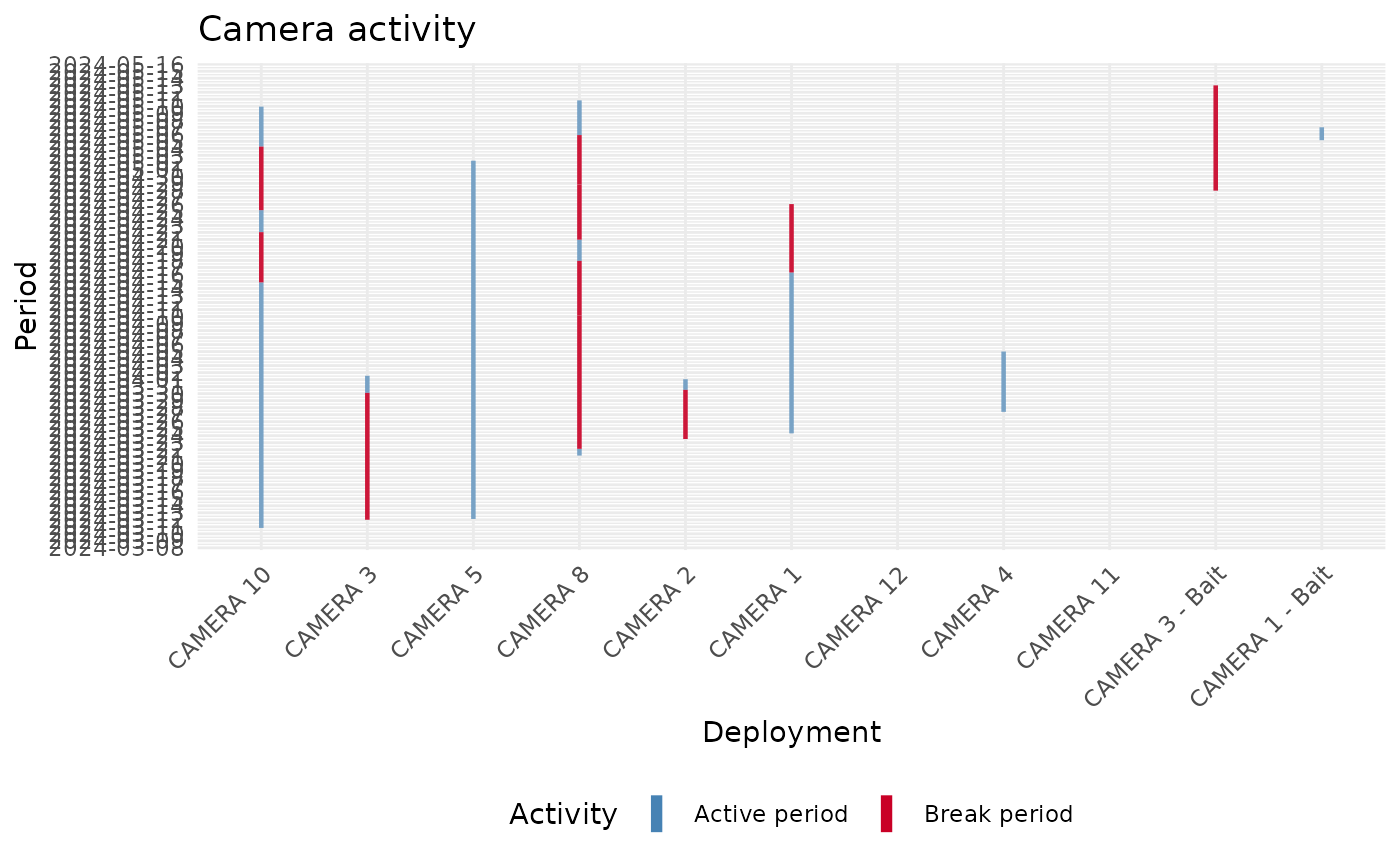
 # The result is a ggplot, so it can be extended with the usual + syntax
ct_plot_camtrap_activity(
data = camtrap_data,
deployment_column = camera,
datetime_column = datetimes,
threshold = 7,
time_unit = "days"
) +
ggplot2::labs(title = "Camera activity") +
ggplot2::theme(legend.position = "bottom")
#> Warning: No deployment has a gap exceeding 7 days.
#> Warning: No deployment has a gap exceeding 7 days.
#> Warning: No deployment has a gap exceeding 7 days.
#> Warning: No deployment has a gap exceeding 7 days.
#> Warning: No deployment has a gap exceeding 7 days.
# The result is a ggplot, so it can be extended with the usual + syntax
ct_plot_camtrap_activity(
data = camtrap_data,
deployment_column = camera,
datetime_column = datetimes,
threshold = 7,
time_unit = "days"
) +
ggplot2::labs(title = "Camera activity") +
ggplot2::theme(legend.position = "bottom")
#> Warning: No deployment has a gap exceeding 7 days.
#> Warning: No deployment has a gap exceeding 7 days.
#> Warning: No deployment has a gap exceeding 7 days.
#> Warning: No deployment has a gap exceeding 7 days.
#> Warning: No deployment has a gap exceeding 7 days.