
This function visualizes the temporal overlap between two species' activity patterns based on time-of-day data. It uses kernel density estimation to estimate activity densities and highlights areas of overlap between the two species.
Usage
ct_plot_overlap(
  A,
  B,
  xscale = 24,
  xcenter = c("noon", "midnight"),
  n_grid = 128,
  kmax = 3,
  adjust = 1,
  rug = FALSE,
  overlap_color = "gray40",
  overlap_alpha = 0.8,
  line_type = c(1, 2),
  line_color = c("gray10", "gray0"),
  line_width = c(1, 1),
  species_names = c("Species A", "Species B"),
  legend_title = "Species",
  overlap_only = FALSE,
  extend = "lightgrey",
  extend_alpha = 0.8,
  rug_length = 0.018,
  rug_color = NULL,
  ...
)
Arguments
- A
A numeric vector of time-of-day observations (in radians, 0 to \(2\pi\)) for species A.
- B
A numeric vector of time-of-day observations (in radians, 0 to \(2\pi\)) for species B.
- xscale
A numeric value to scale the x-axis. Default is 24 for representing time in hours.
- xcenter
A string indicating the center of the x-axis. Options are
"noon"(default) or"midnight".- n_grid
An integer specifying the number of grid points for density estimation. Default is 128.
- kmax
An integer indicating the maximum number of modes allowed in the activity pattern. Default is 3.
- adjust
A numeric value to adjust the bandwidth of the kernel density estimation. Default is 1.
- rug
A logical value indicating whether to add a rug of the observations along the x-axis. Default is
FALSE.- overlap_color
A string specifying the color of the overlap area. Default is
"gray40".- overlap_alpha
A numeric value (0 to 1) for the transparency of the overlap area. Default is 0.8.
- line_type
A vector of integers specifying the line types for species A and B density lines. Default is
c(1, 2).- line_color
A vector of strings specifying the colors of the density lines for species A and B. Default is
c("gray10", "gray0").- line_width
A vector of numeric values specifying the line widths for species A and B density lines. Default is
c(1, 1).- species_names
A character vector of length two giving the legend labels for species A and B.
- legend_title
A character string giving the density-line legend title.
- overlap_only
A logical value indicating whether to plot only the overlap region without individual density lines. Default is
FALSE.- extend
A string specifying the color of the extended area beyond the activity period. Default is
"lightgrey".- extend_alpha
A numeric value (0 to 1) for the transparency of the extended area. Default is 0.8.
- rug_length
A numeric value giving the length of the rug ticks, in normalized plot coordinates. Default is 0.018.
- rug_color
Colour of the rug ticks. Default
NULLdraws each species' ticks in itsline_color. A single colour is used for both species, and two colours are matched to species A and B.- ...
Additional arguments passed to
ggplot2::geom_rug(). The former argument namerug_lentghis still accepted forrug_length.
Value
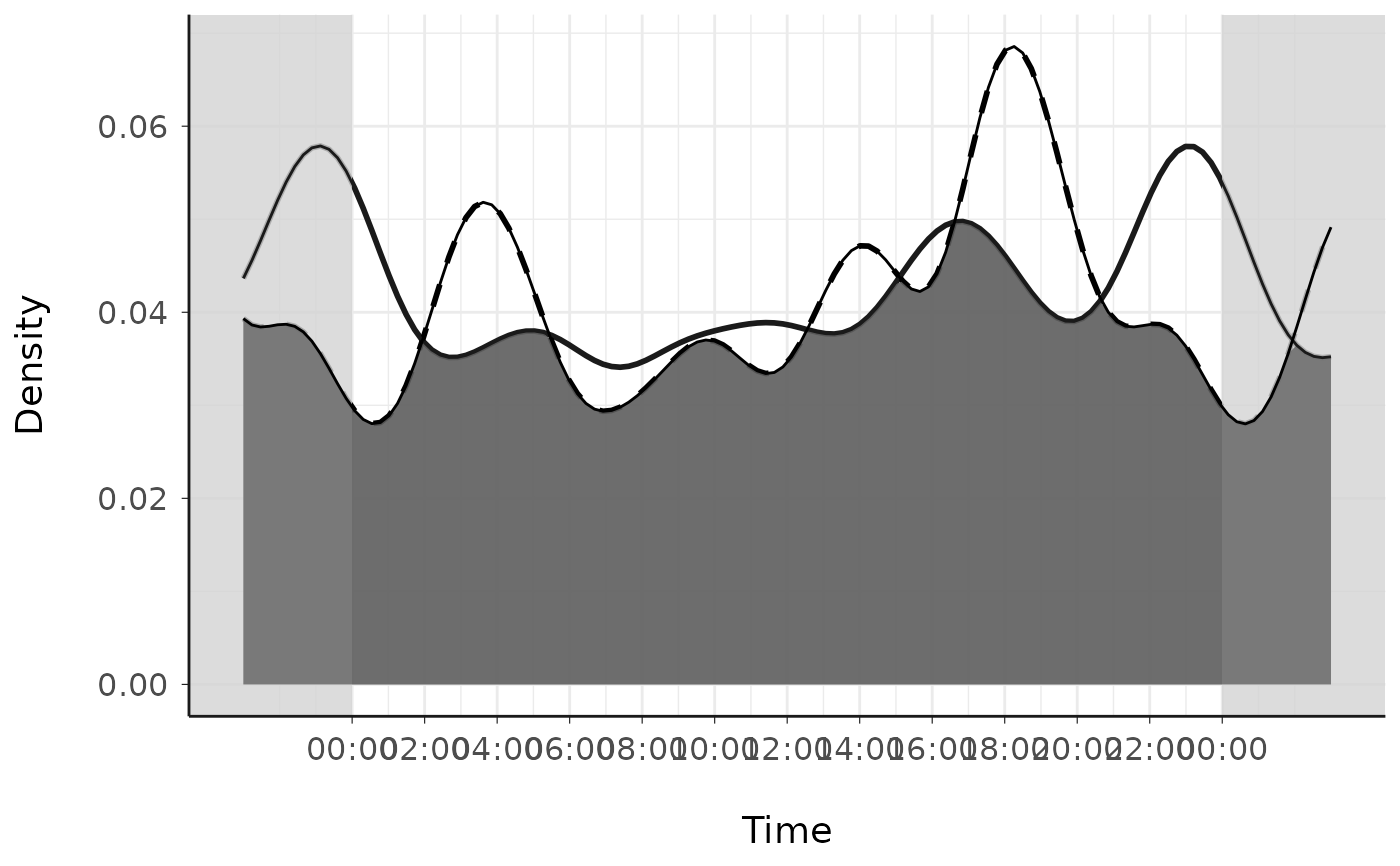
A ggplot object representing the activity density curves and overlap between the two species.
If overlap_only = TRUE, only the overlap region is displayed.
Examples
# Generate random data for two species
set.seed(42)
species_A <- runif(100, 0, 2 * pi)
species_B <- runif(100, 0, 2 * pi)
# Plot overlap with default settings
ct_plot_overlap(A = species_A, B = species_B)
 # \donttest{
# Customize plot with specific colors and line types
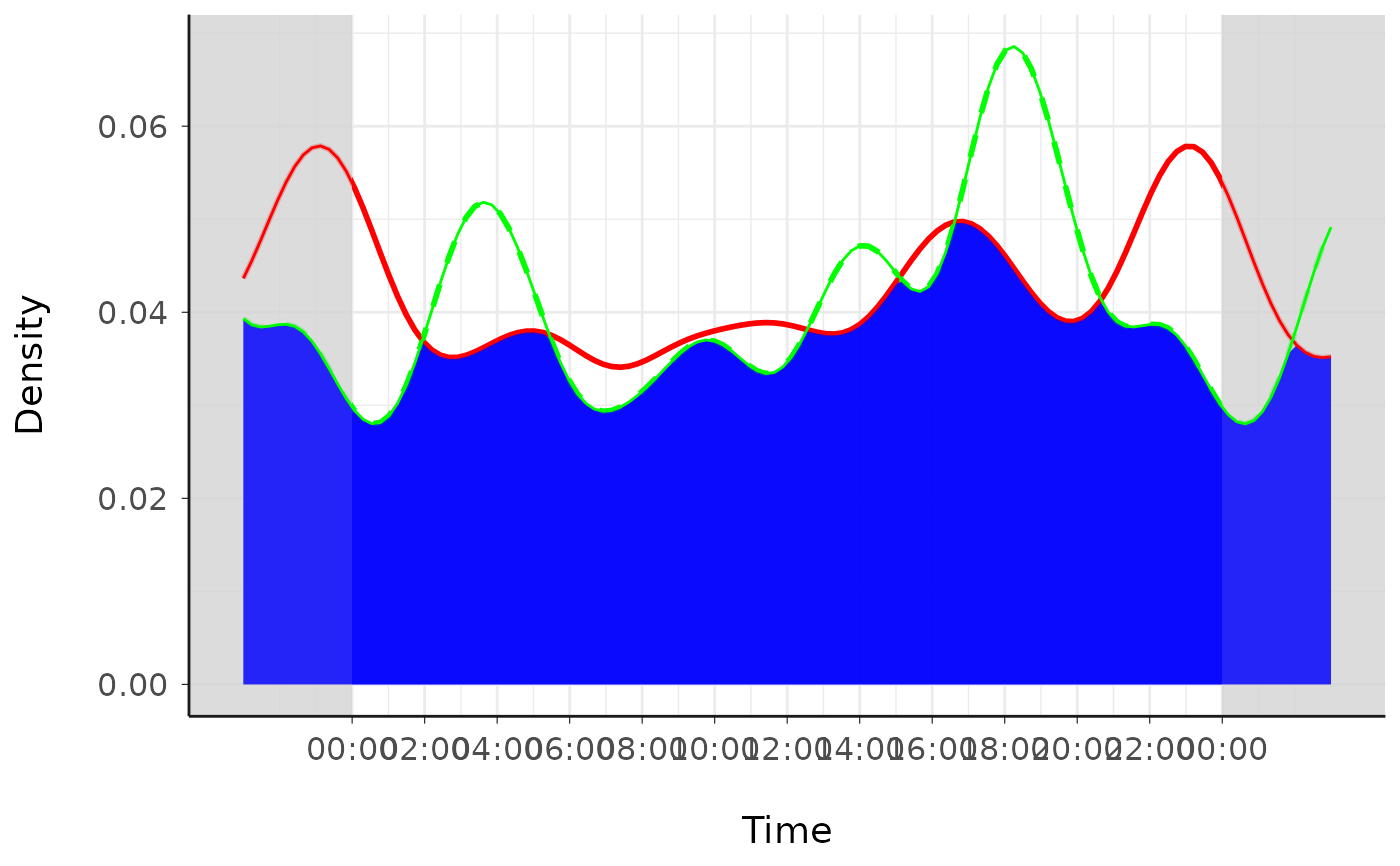
ct_plot_overlap(A = species_A, B = species_B, overlap_color = "blue",
line_color = c("red", "green"))
# \donttest{
# Customize plot with specific colors and line types
ct_plot_overlap(A = species_A, B = species_B, overlap_color = "blue",
line_color = c("red", "green"))
 # Add rug ticks coloured by species
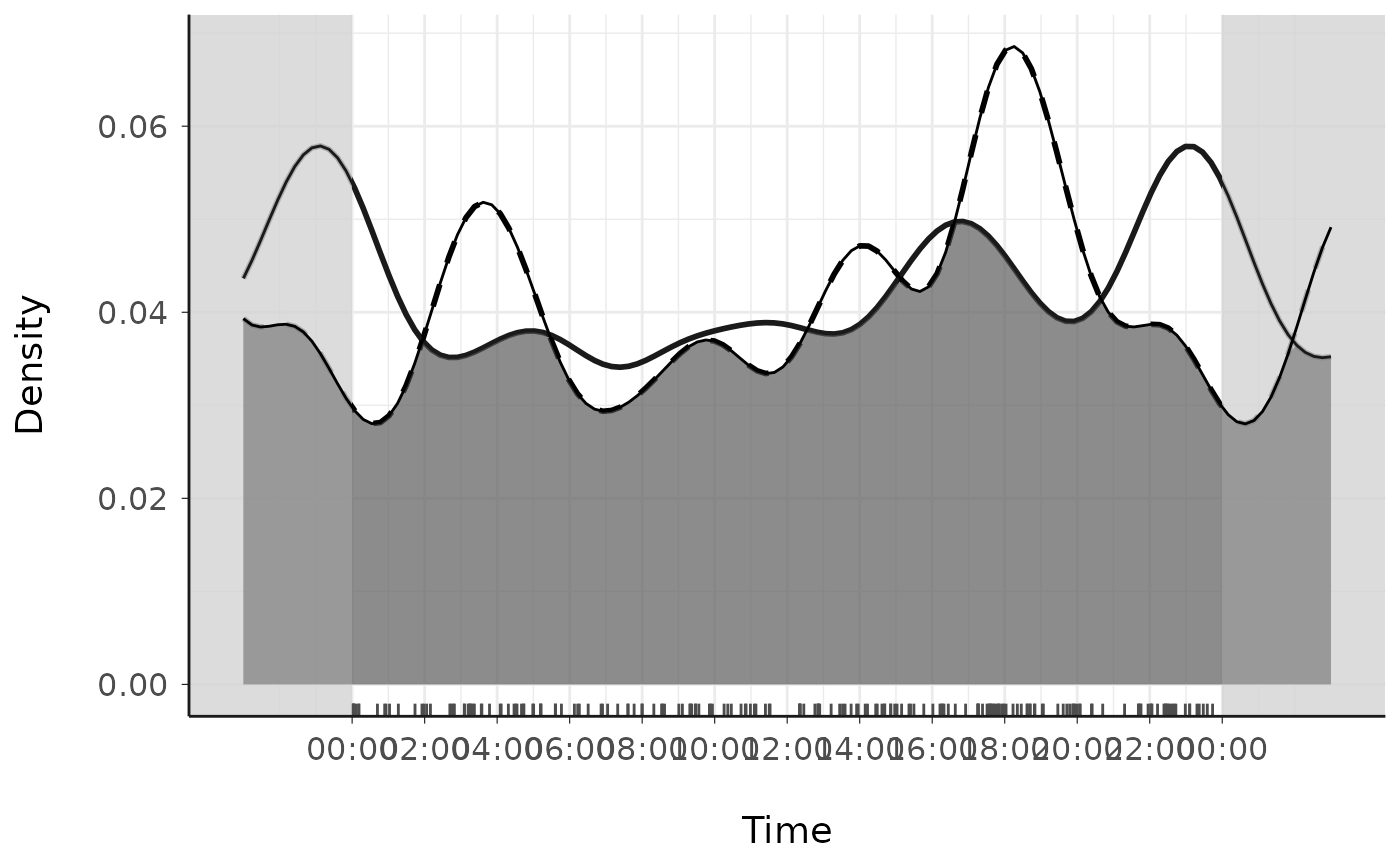
ct_plot_overlap(A = species_A, B = species_B, rug = TRUE,
line_color = c("darkorange", "steelblue"))
# Add rug ticks coloured by species
ct_plot_overlap(A = species_A, B = species_B, rug = TRUE,
line_color = c("darkorange", "steelblue"))
 # }
# }