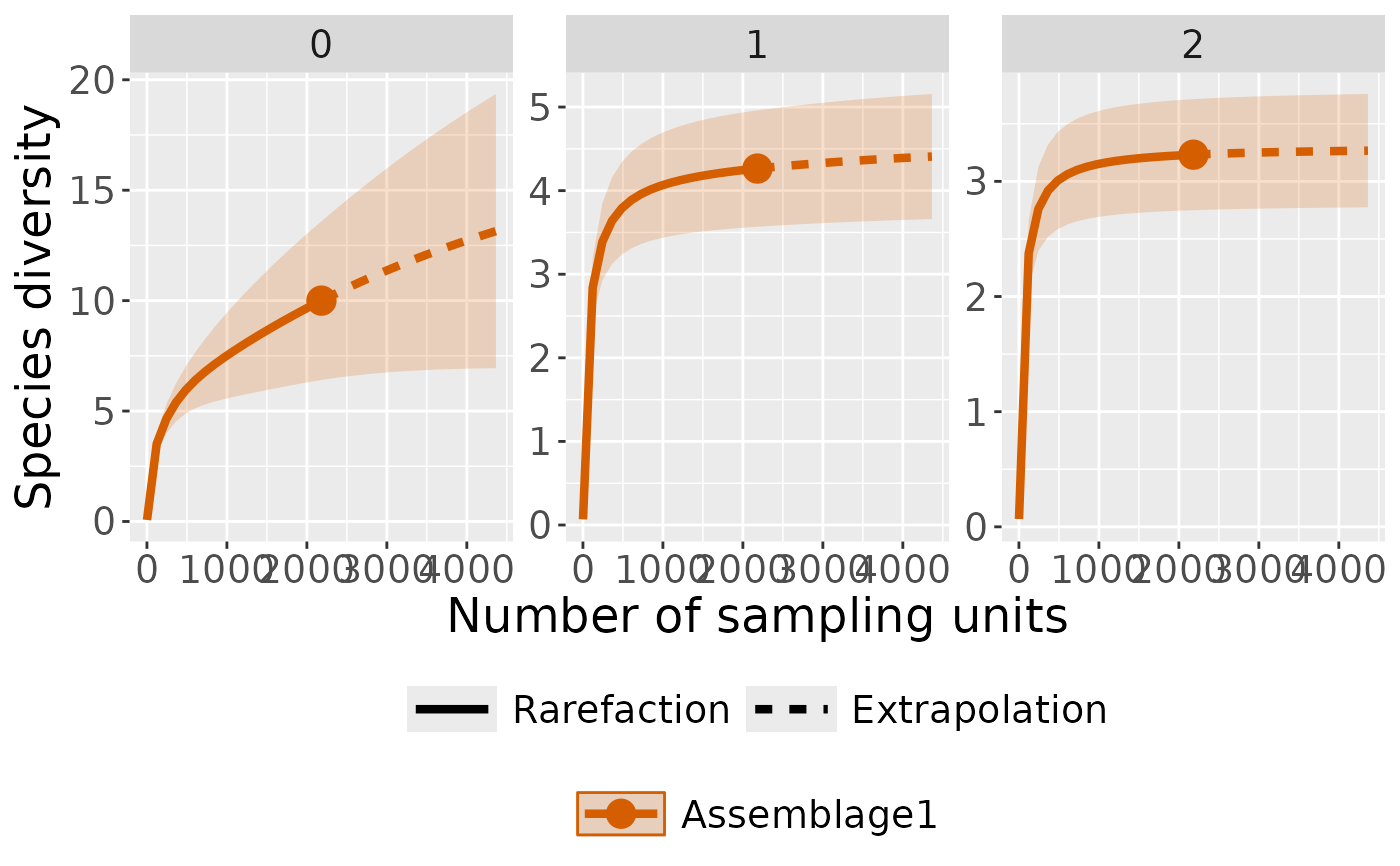
plot sample-size-based and coverage-based rarefaction/extrapolation curves along with a bridging sample completeness curve
Usage
ct_plot_inext(
  inext_object,
  type = 1,
  se = TRUE,
  facet_var = "None",
  color_var = "Assemblage",
  grey = FALSE
)
Arguments
- inext_object
an object as outputed by
ct_inext()- type
three types of plots:
type = 1: sample-size-based rarefaction/extrapolation curvetype = 2: sample completeness curvetype = 3: coverage-based rarefaction/extrapolation curve
- se
a logical variable to display confidence interval around the estimated sampling curve.
- facet_var
create a separate plot for each value of a specified variable:
facet_var = "None": no separationfacet_var = "Order.q": a separate plot for each diversity orderfacet_var = "Assemblage": a separate plot for each assemblagefacet_var = "Both": a separate plot for each combination of order x assemblage
- color_var
create curves in different colors for values of a specified variable:
color_var = "None": all curves are in the same colorcolor_var = "Order.q": use different colors for diversity orderscolor_var = "Assemblage": use different colors for sitescolor_var = "Both": use different colors for combinations of order x assemblage
- grey
a logical variable to display grey and white ggplot2 theme
Examples
# \donttest{
if (requireNamespace("iNEXT", quietly = TRUE)) {
## Import example data
data(penessoulou)
camdata1 <- penessoulou %>%
  dplyr::filter(project == "Last") %>%
  dplyr::mutate(site = "pene") %>%
  # remove consecutive entry of the same species at the same location within 60s
  ct_independence(species_column = species,
                  site_column = camera,
                  datetime = datetimes,
                  threshold = 60, format = "%Y-%m-%d %H:%M:%S"
                  )
head(camdata1)

# Prepare sampling data (camera-day)
camday <- ct_camera_day(
  data = camdata1,
  deployment_column = camera,
  datetime_column = datetime,
  species_column = species,
  size_column = number
)

# RAREFACTION/EXTRAPOLATION
int_ext <- ct_inext(data = camday,
                    diversity_order = c(0, 1, 2),
                    species_column = species,
                    site_column = sampling_unit,
                    size_column = number,
                    n_bootstrap = 50)
int_ext

# plot with curves colored by order
ct_plot_inext(int_ext, type = 1, color_var = "Order.q")

# plot with curves faceted by order
ct_plot_inext(int_ext, type = 1, facet_var = "Order.q")
 }
#> Warning: Insufficient data to provide reliable estimators and associated s.e.
#> Warning: invalid color.var setting, the iNEXT object do not consist multiple assemblages, change setting as Order.q

# }
# }